I fly a Cessna 172N, which comes with a POH with lots of information. One of the more useful tables is the Cruise Performance table shown below (Figure 1). The chart gives the fuel flow rate and true airspeed for various combinations of pressure altitude, temperature, and engine percent power. Unfortunately, the table only provides data at the max gross weight of 2300 lbs. Furthermore, my aircraft recently had an Air Plains modification, replacing the existing 160 hp Lycoming O-320-D2G with a 180 hp O-360-A4M, with a commensurate increase in max gross weight from 2300 to 2550 lbs. The Supplemental Airplane Flight Manual has a Cruise Performance table similar to the one provided in the original POH, but it does not include cruise airspeeds! Furthermore, I often fly around at gross weights less than 1900 lbs. What will be the impact on airspeed and fuel consumption with the higher horsepower engine at reduced gross weights? In this post, I show how to make cruise performance charts for any weight or altitude, and how to estimate the performance of the modified aircraft with the 180 hp engine.
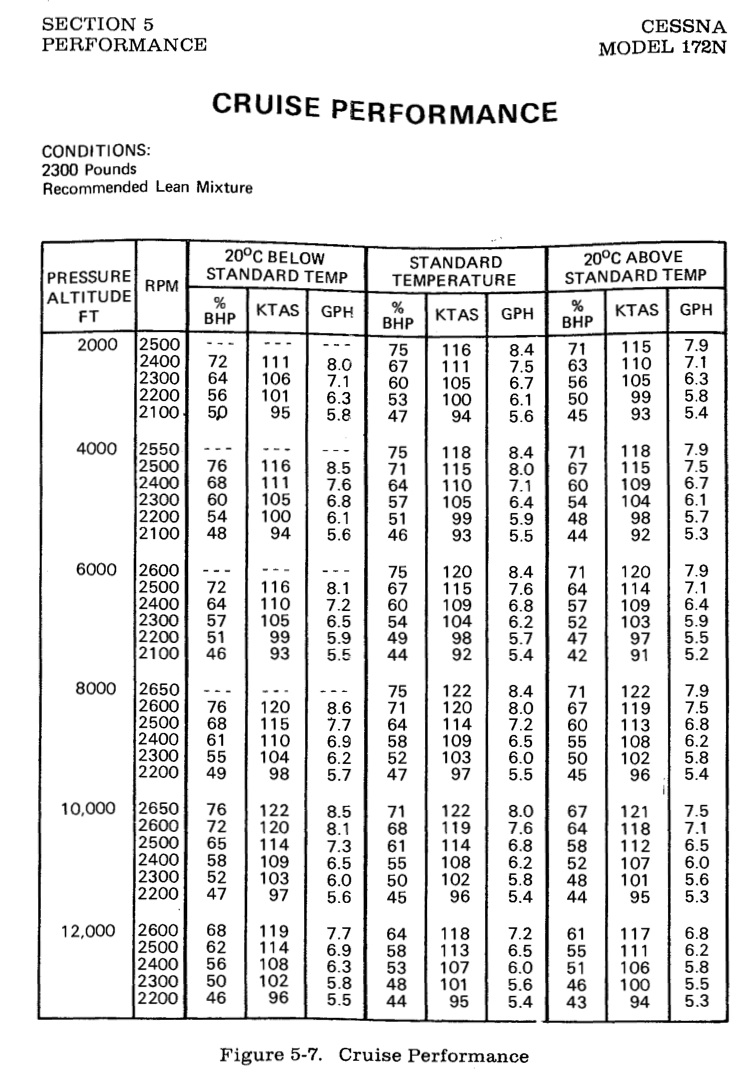
First, let’s take a look at the cruise performance chart for my aircraft taken directly from the original Pilot’s Operating Handbook (my Figure 1, Cessna’s Figure 5-7). This chart is nothing more than a tabular representation of the power curve for this aircraft, with some engine data thrown in for good measure. You may recall that in straight and level unaccelerated flight, the lift  generated is equal to the weight
  of the aircraft, and the thrust
  developed by the engine is equal to the drag
  . The power required to fly in straight and level flight is the thrust times the velocity expressed in true airspeed. In equation form, we have
(1) 
But the power output by the engine, the shaft power, is not the useful power developed by the propeller. The useful power is the thrust times the velocity. The useful power divided by the shaft power is the efficiency denoted by  . The efficiency varies from zero when the aircraft is standing still (because the velocity is zero), to something around 85% in cruise. The efficiency is a function of the advance ratio
  , which is defined as
(2) 
where  is the propeller rotation rate (in radians per second) and
  is the radius. Thus we can write
(3) 
Finally, as is customary, we write the drag in terms of the the drag coefficient,
(4) 
where  is the density of the air,
  is the wing area, and
  is the coefficient of drag. A similar definition exists for the coefficient of lift
  , that is
(5) 
Note in cruise, the lift generated by the aircraft is equal to its weight. In this case, we can think of coefficient of lift as a surrogate for velocity, that is,
(6) 
High speeds correspond to small values of coefficient of lift and vice versa.
One thing you should know is that the coefficient of lift and drag are not independent. In fact, to an extremely good approximation, the coefficient of drag is a function of only the coefficient of lift. One model aerodynamicists use is
(7) 
where  is the zero lift drag coefficient,
  is a constant and
  represents the lift dependent drag. Sometimes people (incorrectly) refer to the first part as the “profile drag” and the second part as the “induced drag” or “vortex drag.” This heuristic is overly simplistic. The second term, in fact, contains both induced and profile drag. Furthermore, in addition to the constant and quadratic terms, a more refined model contains a linear term. In any event, the coefficient of drag is very nearly a function of
  the coefficient of lift, i.e.,
  .
.
Putting all this together, we can express the engine shaft power as
(8) 
We are almost there! Next, we replace the term  with
with  with the result
(9) 
OK… after all this, what do we know? Well, this expression says that the power to fly is proportional to the weight to the power 1.5. So if I increase the weight by 10%, the power required goes up by 15% (for the same coefficient of lift). If I increase the weight by 50%, the power goes up by 84%! This is one reason overloading an aircraft is a really bad thing to do. The power required to fly is disproportionate with the weight increase.
I now make the claim that the function  above depends strongly on the coefficient of lift, and only very weakly on advance ratio. To show this, again using the performance chart provided by Cessna, I plot the advance ratio as a function of coefficient of lift (see Figure 2).
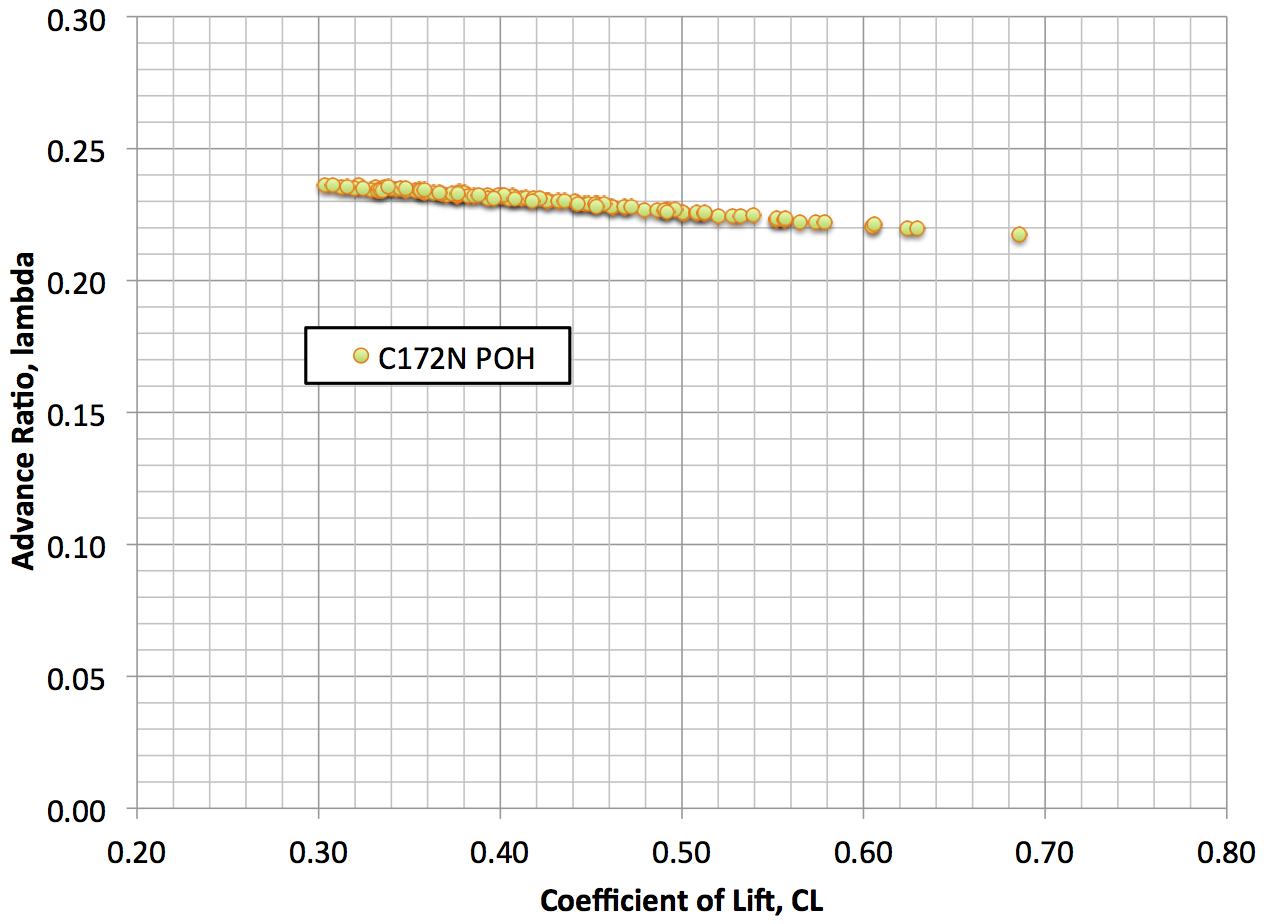 is strongly correlated to coefficient of lift, .
If these two parameters  and
and  were independent, then there would be scatter in the data. Instead, the data produces a line with virtually no scatter. Thus, the advance ratio is itself a function of the coefficient of lift (in straight and level flight for a fixed pitch prop). Thus, the function is a function of only the coefficient of lift, i.e.,
(10) 
So finally, using data in the C172N POH, let’s plot this nondimensional function as a function of the coefficient of lift (see Figure 3).

Note the almost complete lack of scatter. (In fact, what scatter appears in the data appears because of quantization error, as the POH data is only given to two or three significant digits.) This is hardly surprising, as the performance tables are most likely assembled from an algebraic expression deduced from a combination of flight data and analysis. Based on what I know about aerodynamics, and using some curve fits, I reversed engineered this curve. My estimate of the function is
(11) 
This curve is plotted along with the POH data in Figure 3. Note the excellent agreement. But more to the point, with this curve in hand, we can now construct new performance tables at different weights, or even for different power engines — with the assumption that the propeller efficiency is about the same for the two installations.
So here is the algorithm, which I implemented in a Microsoft Excel spreadsheet.
- Fill a spread sheet with columns containing the desired pressure altitude, temperature, aircraft weight, and engine horsepower.
- For each condition (row), compute the atmospheric density using U.S. Standard Atmosphere equations.
- Using the power, aircraft weight, and atmospheric density, compute the value of the function . (Equation 10.)
- Solve Equation 11 for the value of that gives the same value of . This can be done graphically using Figure 3, but this procedure doesn’t work well in a spreadsheet. I used a technique known as Newton’s method, but a lookup table would work too.
- Using the computed coefficient of lift, the known aircraft weight, and the atmospheric density, compute the calibrated and true airspeeds using Equation 6. Use the density at altitude to get true airspeed; use standard sea level density to get calibrated airspeed.
Shown in Figure 4 is just such a table, constructed for a gross weight of 1900 lbs, and for an installed engine power of 180 hp. I have omitted the RPM data, and used the same percent powers as appeared in the original table (12.5% greater power than in the original table). If you compare the airspeeds in the chart in Figure 4 to those in Figure 1, you will see the airspeeds are 8 knots or so higher at 8,000 ft at high power settings. most of the increase is due to the increase in power. At lower power settings or very high altitudes — both correspond to lower calibrated airspeeds and thus high coefficients of lift — about half the increase in speed is due to the lower weight (higher ) and half due to increased horsepower.

A couple of disclaimers are in order. First, the equations presented here are dimensionally consistent. I tend to use the British system, so speed is in ft/sec, density in slugs/ft^3, etc. Or alternatively, you may SI units, meters/sec, kg/meters^3, etc. Only after doing any computions should you convert the results to knots, density altitude, etc. Second, the data provided here is for educational purposes only. Always use your official POH!
So that’s it. Next, I intend to take some flight test data to see how well my airplane performance matches this data. Watch for these results in a future post.
I’m not an engineer and this math is way beyond where I would take it — no scratch that, it’s way beyond where I do take it. I don’t trust the charts on my older 172 or 152. They use more fuel. My simple answer is I land more often than I really need to because I don’t want to be one of those pilots who runs out of fuel while flying. My basic math is figure out how much fuel you think you need and add 30%.
I love the academics of what you’ve done. I worry a little that you might get too involved in the testing of the math and efficiency and run out of fuel. Be careful. I want to see more math in the future:) !
Thanks for your comments.
I have found the performance charts to be remarkably accurate, but only if the engine is properly leaned. If you run full rich all the time, the charts will definitely not work well!
Not to worry, I am a very cautious pilot, and always plan a healthy fuel reserve.
I have a small complaint with your description of terms in eqn 4. You write,
(1)
where is the density of the air,
  is the wing area, and
  is the coefficient of drag. A similar definition exists for the coefficient of lift
  …”
…”
But is not the wing area.
  is the frontal area of the aircraft, if I’m reading the equation right.
RB, Thanks for you comment. Equations (4) and (5) are correct. These are the classic definitions of the coefficients of lift and drag. In aerodynamics, the wing area S is used. In some other areas of engineering, for example automobile design, the area used is the frontal area. Hope that helps.