We all know how aircraft accidents end, with a damaged or destroyed airplane, and injured or dead crew and passengers. But how do they start? Most accidents are the result of a long chain or web of events stretching back well into the flight, or even earlier. Twenty-four years ago, United Airlines Flight 232 crashed into an Iowa corn field due to a catastrophic engine failure, ultimately caused by a manufacturing defect in the fan disk, and the failure of maintenance procedures to detect the growing crack in the disk. That flight was destined to crash before it took off.
The chain of events stretches back from the accident itself, with one contributing cause layered on top of another. Accidents can be prevented by breaking the chain anywhere along the causal sequence. Asiana Flight 214 crashed because it approached Runway 28L too low. It was too low because earlier the airplane had slowed well below its target approach speed, and the pilots therefore could not maintain altitude. At least part of the reason it slowed below its approach speed was because the autopilot had been disengaged, and the pilots believed that the autothrottle was still engaged when it wasn’t. But why had the pilots switched off the autopilot? Perhaps in part because the approach was unstabilized, too high and too fast, and the pilots could not acquire the glide slope without hand flying the aircraft. It will be a long time before we know the full story, but one question that will have to be addressed is whether the decision not to go around was a major link in the accident chain.
Many of the pilot commenters in my earlier post believe that the pilots should have gone around at least by the time they reached 1000 ft, and indeed some airlines have policies that require a go-around for an unstabilized approach at 1000 ft, which on a 3 deg glide slope occurs at about 3 nm out from the touchdown zone. Flight 214 was far from stabilized at that point.
How unstabilized was the approach? Blog reader and fellow pilot Sam Sun did a very nice piece of data analysis, which I’m tempted to take credit for, but won’t. Sam plotted the groundspeed and altitude vs. distance from the touchdown zone for 153 777’s arriving to KSFO Runway 28L and 28 R. To do this, Sam scraped data for 777 flights over about 19 days (for days both before and after the accident) from FlightAware.com. (He removed flights that aborted their landings.)
There are necessarily some limitations to the data. The data shows groundspeed, when it’s really airspeed that’s needed, but that’s not really available. Not all the arrivals are visual approaches; some are likely RNAV or LOC approaches. Despite these limitations, we can use these plots to get a sense of how unusual the accident approach was.
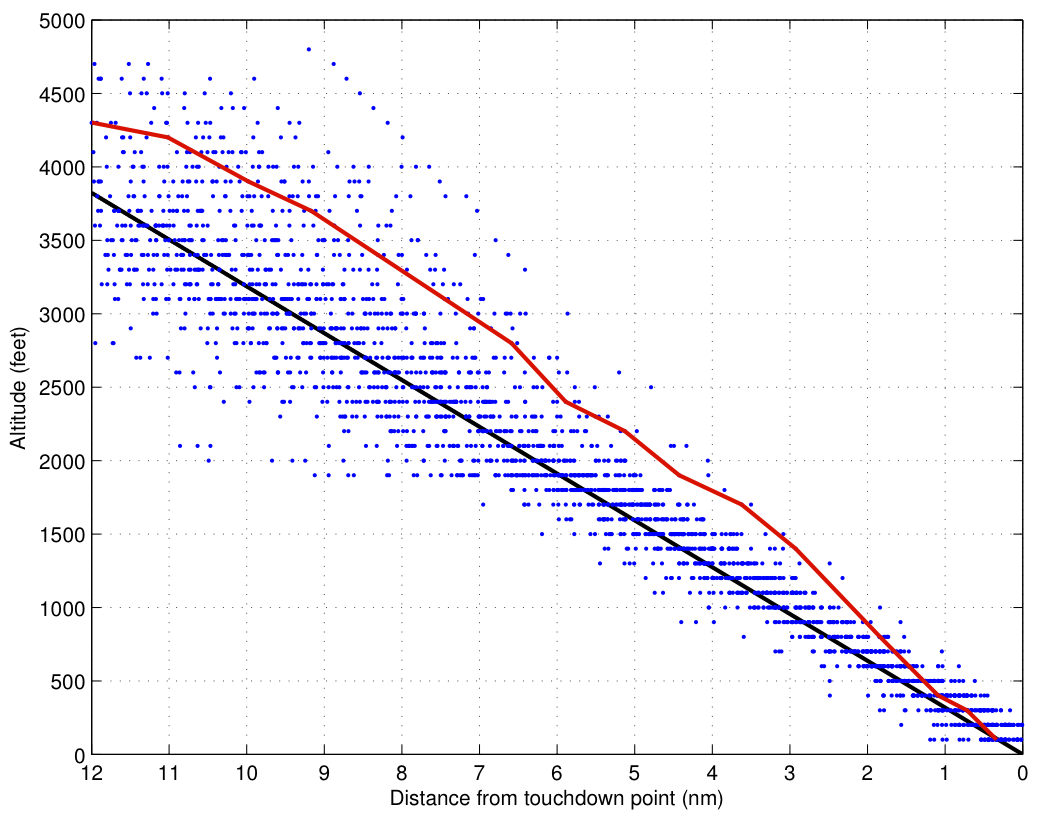
The first plot shows altitude vs. distance from the touchdown zone:
All the data except for the accident aircraft are shown as blue dots; the data for Flight 214 are shown as a solid red line. Note that except for Flight 214, you can’t tell the trajectory of any single flight. That’s probably OK, though, because what the plot tells us is still very interesting. When flying the visual (or other) approaches, the goal is to end up over the San Mateo bridge 5 miles out at about 1900 ft, to intercept the glideslope. It’s apparent in the data that most flights do a pretty good job of establishing on or near the glideslope by this point, with a standard deviation of perhaps 200 ft (estimated by eye, so don’t take this number too seriously). But Flight 214 is a an outlier — it’s 400 or 500 ft high at that point. There are only one or two flights that have a greater deviation from the desired flight path at that point.
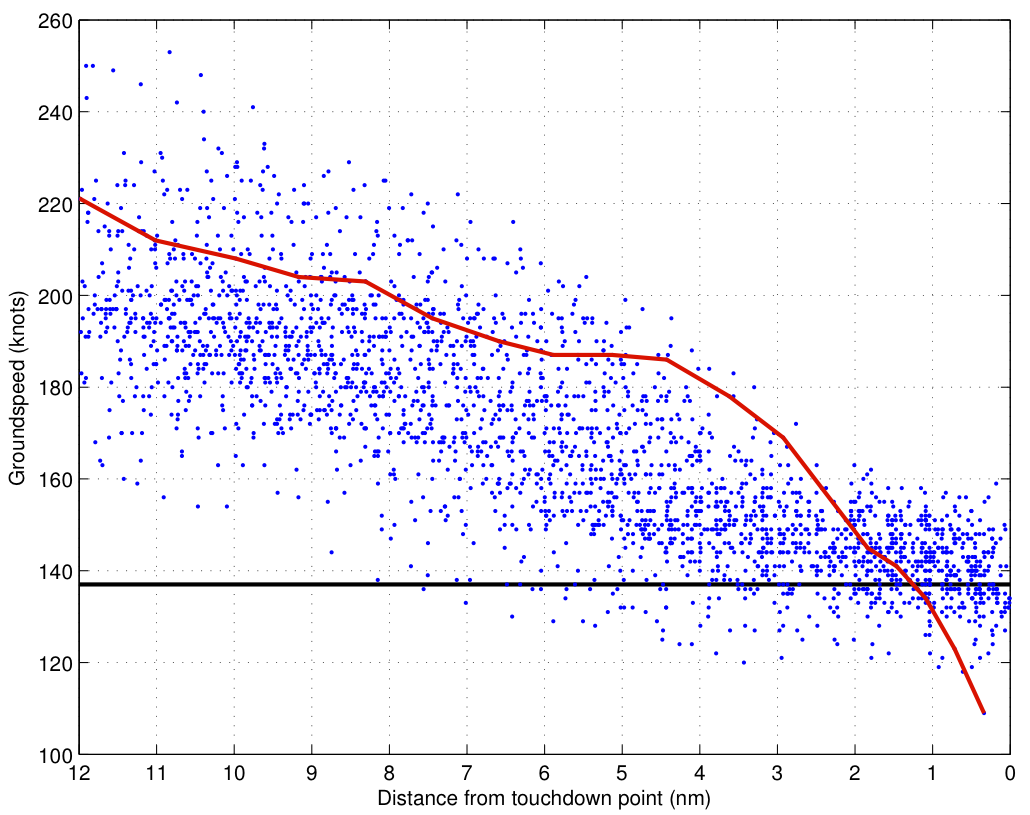
The second plot shows groundspeed vs. distance from touchdown:
 We know from the NTSB that
 ![]() for Flight 214 was 137 kts. The target approach speed would typically be maybe 5 kts faster. We don’t know
for Flight 214 was 137 kts. The target approach speed would typically be maybe 5 kts faster. We don’t know ![]() for any of the other flights, but it would presumably be in the same ballpark. (
for any of the other flights, but it would presumably be in the same ballpark. (![]() goes as the square root of the weight of the aircraft, so an aircraft 10% heavier would have a
goes as the square root of the weight of the aircraft, so an aircraft 10% heavier would have a ![]() about 5% faster.) Furthermore, aircraft arrive at the bridge, 5 nm out, typically faster than the target approach speed, and slow as they proceed along the approach. But it takes time to bleed off speed, so speed at the bridge is important. Here again, Flight 214 is fast, perhaps in the 90th percentile or above. It’s both high and fast, and so is certainly starting out as a high energy approach.
about 5% faster.) Furthermore, aircraft arrive at the bridge, 5 nm out, typically faster than the target approach speed, and slow as they proceed along the approach. But it takes time to bleed off speed, so speed at the bridge is important. Here again, Flight 214 is fast, perhaps in the 90th percentile or above. It’s both high and fast, and so is certainly starting out as a high energy approach.
Proceeding from the bridge, it can be seen that most flights are already decelerating, and reach their target speed by about 3 miles out. That’s important, because the approach should be fully stabilized by the time they reach 1000 ft. (On a 3 deg glideslope, the correct altitude is 956 ft.) But even though Flight 214 is both high and fast, it doesn’t begin decelerating for another half mile, and then not at a rate that will get to the target speed by 3 miles out. As a result, at 3 miles out Flight 214 is still very fast, about 170 kts, 33 kts above ![]() .
.
Note that almost all flights are well established on the glide slope, with most within ![]() feet by 3 miles out. Indeed, for an ILS approach, 100 ft at 3 nm is 0.3 deg, or 1.5 dots deviation, large enough for a callout by the pilot not flying. Of course, Flight 214 was on a visual approach, but at 3 miles out it is nearly 500 feet off the nominal glideslope. At that large deviation, the PAPI would have had 4 white lights. So Flight 214 is an obvious outlier in both speed and altitude 3 miles out, when it should be established on a stabilized approach.
feet by 3 miles out. Indeed, for an ILS approach, 100 ft at 3 nm is 0.3 deg, or 1.5 dots deviation, large enough for a callout by the pilot not flying. Of course, Flight 214 was on a visual approach, but at 3 miles out it is nearly 500 feet off the nominal glideslope. At that large deviation, the PAPI would have had 4 white lights. So Flight 214 is an obvious outlier in both speed and altitude 3 miles out, when it should be established on a stabilized approach.
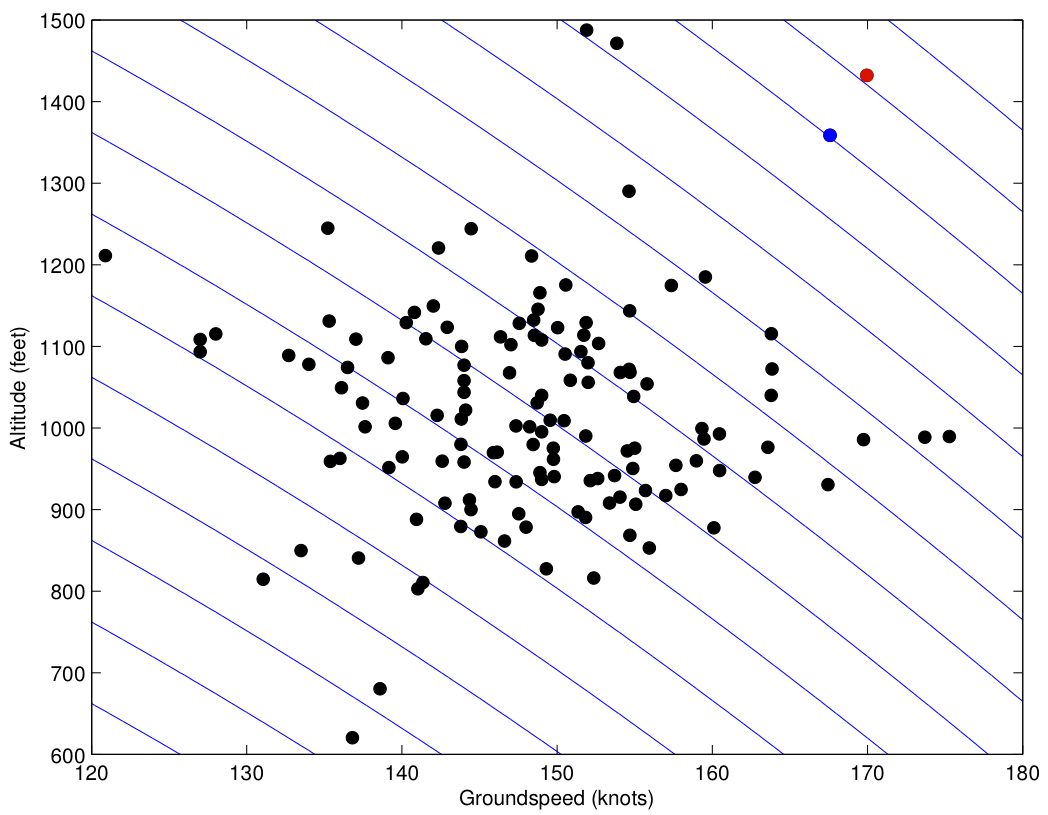
To get a feel for how much of an outlier this approach is, I added an additional plot to Sam’s. I plotted both groundspeed and altitude at 3 miles out as a scatter plot, with each dot representing a single flight:
The blue contours represent constant total energy (expressed as the energy height, ![]() , explained in an earlier post). The difference in energy between adjacent contour lines is equivalent to 100 ft in altitude. There are actually only 138 flights represented, because I removed some flights with apparently bad or incomplete data. Note that the majority of flights are near 1000 ft and 150 kts, nicely stabilized for landing. Of course, there are outliers. Asiana Flight 214 is the biggest outlier, represented by the red dot. Because it’s both high and fast, it has an excess energy equivalent to about 900 ft in altitude (assuming a target speed of 142 kt, 5 kt above
, explained in an earlier post). The difference in energy between adjacent contour lines is equivalent to 100 ft in altitude. There are actually only 138 flights represented, because I removed some flights with apparently bad or incomplete data. Note that the majority of flights are near 1000 ft and 150 kts, nicely stabilized for landing. Of course, there are outliers. Asiana Flight 214 is the biggest outlier, represented by the red dot. Because it’s both high and fast, it has an excess energy equivalent to about 900 ft in altitude (assuming a target speed of 142 kt, 5 kt above ![]() ). It’s in the 98th percentile for both groundspeed and altitude. Of course, some aircraft has to be in the 98th, 99th, or even 99.999th percentile, so that by itself doesn’t mean that the approach was risky.
). It’s in the 98th percentile for both groundspeed and altitude. Of course, some aircraft has to be in the 98th, 99th, or even 99.999th percentile, so that by itself doesn’t mean that the approach was risky.
But even when this aircraft was at 1400 ft, it would have been impossible to stabilize the approach at 1000 ft, because it was already over the point where it should have been at 1000 ft. To reach the glideslope at 500 ft, the pilots had to dive down 900 feet over a distance of 1.5 nm, while simultaneously losing 30 kts to be near ![]() , requiring a descent rate of about 1400 fpm, not extremely excessive, but probably higher than acceptable that late in the approach. Even then, they would have had to arrest the descent and add just the right amount of power to stabilize the approach. Had the autothrottle been working (or had they monitored airspeed, or had an airspeed warning), they might have done all that.
, requiring a descent rate of about 1400 fpm, not extremely excessive, but probably higher than acceptable that late in the approach. Even then, they would have had to arrest the descent and add just the right amount of power to stabilize the approach. Had the autothrottle been working (or had they monitored airspeed, or had an airspeed warning), they might have done all that.
So it’s certainly possible that a safe landing might have been made. But possible isn’t really good enough, given that there are approximately 30,000 commercial flights a day in the U.S, or more than 10 million a year. A safe landing has to be essentially certain, not merely possible or even probable. That’s why airlines have policies requiring a go around if an approach is not stabilized by a given altitude above touchdown, as low as 500 ft in good weather, and 1000 ft in instrument conditions, but 1000 ft period at some airlines.
The analysis here is quick and dirty — this is a blog, after all, not a dissertation — and the data haven’t been carefully validated. At her briefing of July 9, Deborah Hersman announced that the NTSB has requested from the FAA all data for 777 approaches to 28L “within the last few days,” and data on go-arounds for that runway since June. So it appears that the NTSB intends to do an analysis, perhaps similar to that performed here. It will be interesting to see how they interpret their data set.
One more thought: Of all the flights in the scatter plot above, two stand out as being both high and fast. One is the red dot of Asiana Flight 214 on July 6. The other one, the blue dot, is Asiana Flight 214 two days earlier. That may be of interest to the NTSB as well.
Update
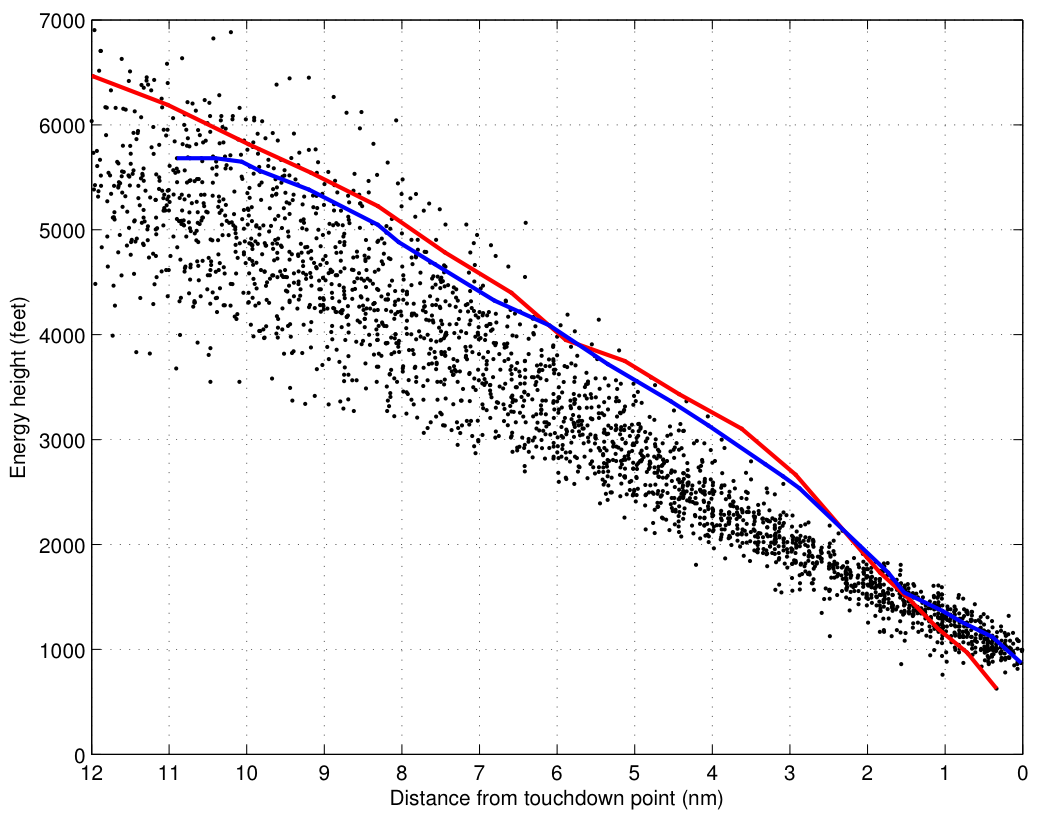
At the suggestion of Kenneth, I’m adding a plot of energy height vs. distance from touchdown point, this time including both the July 6 (red) and July 4 (blue) Asiana 214 flight trajectories. It’s pretty clear that both of these are high energy approaches, both with profiles that put them in the 98th percentile for energy from 5 miles out until only 2 miles out. Indeed, the trajectories are nearly identical until that point. It’s a good visualization of why unstabilized approaches are a bad idea — if just the right change doesn’t occur at the last moment, the outcome can be bad. On the other hand, with a stabilized approach, only very small changes need to be made.


…thank you Steve. Again superb work and suggestions by all readers. I must reiterate, how are we to break the chain of events associated with a single incident if we have not focused our scope on the decades-overdue need to break the chain of automation addiction that, while likely a convenient tool for a management tasked with flying a balance sheet, has since its commercial introduction (in spite of the aviator or his/her true opinion of what would make his/her job easier and therefore safer) saturated the flyer with tasks unrelated to his profession.
To reach the glideslope at 500 ft, the pilots had to dive down 900 feet over a distance of 1.5 nm, while simultaneously losing 30 kts to be near Vref, requiring a descent rate of about 1400 fpm, not extremely excessive, but probably higher than acceptable that late in the approach.
At my company (MD11, B727) and my previous company (DC9, A320) other than the vertical speed required to remain on glideslope, the VSI may never exceed height above ground — therefore, 1400 fpm was roughly 40% greater than acceptable.